
Chapter 20—Measuring to Improve Performance and Results—from the Industrial and Manufacturing Wellness Book Explaining the PWWEAM Methodology
How to monitor and measure processes such as engineering, operations, or maintenance to change and continually improve them so that you can make them world class?

Once you have a lousy process design, you will get lousy results until you get a better design—nothing else can bring lasting process management success except having the right process design in the first place.
Using the information that shows up in management dashboards can wreck your company. Measuring a process does not put you in control of it. A process is totally self-controlled. You always get what the process gives you. Organizational processes work well, or do not, because of their design.
A business process that cannot achieve its aims is the wrong design for its purpose. It is a mockery to use business performance indicators to observe company or department behavior. Financial performance and productivity results are interesting for a business to know, but they are point-in-time samples of what your processes were producing at that moment.
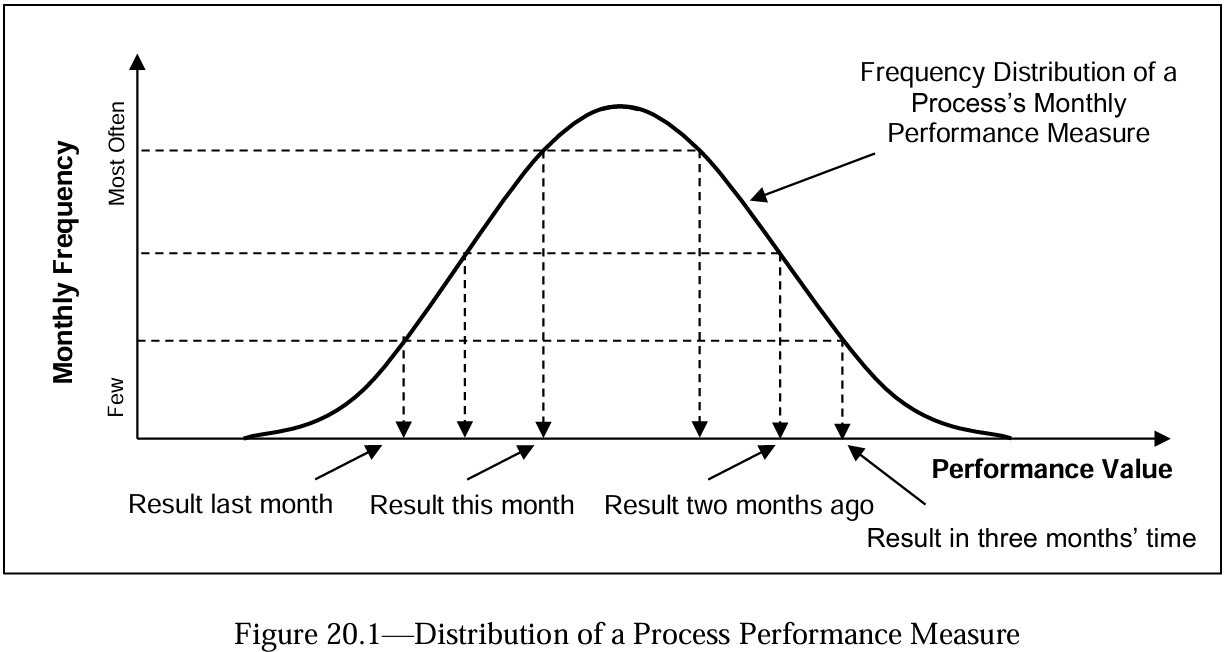
The data in weekly, monthly, and annual performance charts are the results your processes let you have. When you take another sample in the following period, you will get a different result. If a performance chart contains only natural outcomes, then that is the best the process can give, and there is nothing more you can do about it. If you don’t like it, the only choice is to change design and build a better process.
With this post, paid subscribers can download Chapter 20 of the Industrial and Manufacturing Wellness Book (extended version): Measuring to Improve Performance and Results. Everyone else and free subscribers have the following chapter summary.
Chapter 20 Summary – Measuring to Improve Performance and Results (ChatGTP generated)
Chapter 20’s central thesis is that measurement alone doesn’t control a process — process design does. Dashboards and monthly KPI snapshots are only point-in-time samples of what the current process will allow; they do not change the underlying process behaviour. If a process is inherently incapable of meeting its aims, no amount of reporting or “tweaking” of a stable process will reliably improve outcomes — the only solution is redesigning the process itself.
The chapter distinguishes KPIs (outcome-level measures that reflect the combined effect of all influences on a process) from PIs (step-level measures that reveal variability inside process steps). It recommends installing monitoring directly into process maps and ACE 3T procedures: identify step inputs/outputs, set measurable quality tolerances, and chart those variables so you can see whether a step — or the whole process — is operating stably or drifting.
Two complementary tools are emphasized: run charts (time-ordered events/results) and frequency-distribution curves derived from those run charts. Together they reveal stability, probability of future outcomes, common-cause vs special-cause patterns, and whether the process distribution is “tight” and on target or wide and misaligned. Examples (fire events, weekly breakdown hours, plant uptime) show how distributions expose recurring problems, catastrophic outliers, or clusters of short outages that drastically reduce long-run profitability. The chapter explains how to interpret these shapes and what they imply for reengineering priorities.
The chapter also stresses the critical role of the maintenance department. Effective measures should track whether maintenance eliminates failure causes, improves equipment reliability, enhances procedures, and raises workforce skills. Maintenance must focus on creating reliability and reducing risk, not just addressing breakdowns and doing scheduled preventive maintenance. World-class businesses use small, highly skilled crews who apply precision methods and continuously improve processes.
The chapter closes with a list the kinds of maintenance KPIs/PIs that matter (e.g., time spent eliminating root causes, improving procedures, training, stores/process improvements) and the major mechanical and electrical failure mechanisms to eliminate (lubricant degradation, imbalance, misalignment, contamination, high temperature, moisture, etc.). The argument: maintenance must shift from firefighting to proactively creating reliability — a small, highly skilled crew using precision maintenance and continuous process improvement delivers the greatest business value.
Put the Knowledge in Chapter 20 to Effective Use
Practical guidance: when you change a process, collect ~10–12 new samples and superimpose the new distribution on the old one to assess whether the change moved outcomes into a genuinely better region. If not, continue redesign work rather than assuming improvement.
Ultimately, measurement in the Plant Wellness Way methodology is not about monitoring results for their own sake, but about using indicators and statistical analysis to expose weaknesses, guide process redesign, and secure lasting performance improvements.
Once you read the chapter, let me know if you have any questions.
All the very best to you,
Mike Sondalini
P.S. The entire Industrial and Manufacturing Wellness book (Extended Version) worth USD $96 is available to download to paid subscribers for USD $5 per month or USD $50 per year. Paid subscribers get all 26 chapters, including worked examples, two chapters per week. Once all chapters are released the PWWEAM methodology will be applied to analyze and provide solutions to real problems and high risk events faced by operating sites and organizations. Subscribe now and get each chapter in the extended version of the Industrial and Manufacturing Wellness book along with all future newsletters emailed to your inbox.
The rest of this post is for paid subscribers.