
Step 4 of 7: Map Your Processes & Procedures to Find the Utmost Chances of Success
Do a Chance of Success Map of Your Processes and Procedures to Find the Risks of Process Failure, and then Maximize the Chance All Tasks Will be Successfully Done


This week we cover one of the great innovations PWWEAM methodology brings to organizations—how to gauge and then maximize the chance your processes and procedures will be successfully done.
Everything you do is probabilistic. Meaning, all that you do is subject to or involves chance variation
Nothing we do is totally in our control. Our world and our lives are probabilistic—there are varying degrees of uncertainty in our choices and actions. No matter how well you plan and prepare yourself to do a thing, there is a chance that something unintended or unexpected will happen. These disruptive events that prevent total control are caused by ‘chance variation’ that produces irregularities in processes. Disruptive chance variations can be things you cause, or they can be caused by others, producing consequential impacts on you. Chance variations can have positive outcomes for us, or they can have negative outcomes.
If you are in a vehicle going somewhere there is a chance you will have a road accident. The chance of a road accident is higher if it’s a novice driver at the wheel than for an experienced driver. When you lift a glass of water to drink there is a chance you will drop it. Dropping a glass is more likely when it is a toddler lifting the glass, or the glass it is in the hands of a geriatric. Driving accidents and broken drinking glasses happen many times everyday all around the world. They are examples of chance variation events—irregularities and mistakes that happen to lots of people, but they may never happen to you your entire lifetime. That is how probability works.
Doing maintenance on equipment and infrastructure has many opportunities for disastrous chance events. To reduce the odds of unexpected and unwanted events happening during a maintenance job we do maintenance work order planning and resourcing. Planning how to do work safely and correctly with all the right parts and skills produces many more successful jobs than if planning is not done.
In the PWWEAM methodology, we prevent negative ‘chance variation’ and encourage successful outcomes in maintenance job planning by creating a well defined and comprehensive maintenance work order planning and resourcing process. We develop a detailed maintenance work order planning and resourcing procedure explaining how to properly complete the job planning process. It fully explains each task and activity the Planner needs to do to build great work packs so maintenance jobs can go faultlessly. But the maintenance work order planning and resourcing process and its procedural tasks are themselves all probabilistic. Chance variation is possible with everything the Planner does. If we could identify where in the planning and resourcing process the Planner has the greatest chances of making mistakes, we could proactively stop the mistakes from happening.
A simple Chance of Success Mapping a process example
PWWEAM uses a foresight-based risk elimination methodology to estimate the chance of successfully completing a process and all its tasks called Chance of Success Mapping. A simple example follows.
Chance of Success Mapping analysis starts by flowcharting the process of crossing a busy road, as shown in the figure below. The aim is to understand how each step can be made more successful. By removing the risks of failure at each step and introducing more effective step practices the chance of process success rises. This example maybe simple, but it applies to every kid who walks across a road to get to school. It applies to everyone who has to cross a road to go work or to the shop.
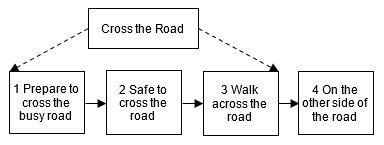
The process is put into a spreadsheet as shown in the table below. The steps go across the top of the table and the risk analysis and chance of success investigation is conducted underneath. The process is a series—if one step is done poorly, the whole process performs poorly. Any step done wrongly when crossing a dangerous road increases the chance of being run over or getting seriously injured. Successfully crossing the road depends on preparing yourself well and on ensuring that nothing bad happens as you cross the road.

Estimating Your Lowest and Highest Chance of Success
The chance of successfully crossing the road diminishes with every risk you face, and it improves with every uncertainty you remove. Since the risk to a process is the sum of the risks in each step, you investigate each step to see how they could be failed. Each possible cause of a step’s failure, each weakness in correctly doing a step’s task is a risk and is noted in the table. For every risk, you look into what can be done to remove its causes and promote the step’s chance of success. The new risk mitigations are recorded in the table. The mitigations that are effective at improving a step’s chance of success will become part of the process and get written into its procedure.
When crossing a busy road you will most often cross it successfully, but occasionally you will not because of present dangers. Using your own experience, you judge that for every 100 times you’ve arrived at a busy road, you haven’t been able to cross it safely every time. That historical evidence you’ve accumulated over the years is used to gauge the lower and upper chances of completing each step of the road crossing process. There is a degree of uncertainty in estimating the chance of success range, but you are unlikely to come up with wild, crazy values if estimates are based on factual historic information from similar past situations.
The individual steps’ chance of success multiply together to give you a low to high range for the chance of success of completing the whole process. In the table, the initial chance of successfully crossing the road ranges from 86% to 98%. An 86% chance of success of safely crossing the road is too low. Because you’ve identified the risks in each step, you choose mitigations to eliminate them or minimize their impact on a step’s success. To estimate the revised chance of success range, you presume that the new risk controls are in place and will be properly done. With the added risk mitigations the chance of safely crossing the road goes up to 97% to 99%.
If the mitigated range of risk is still unacceptable, it becomes necessary to find more risk reductions. For example, you stipulate using traffic lights controlled for pedestrian crossing, or walking over a pedestrian bridge when one is available.
The next newsletter: Find where Maintenance Planners make mistakes, and how to help prevent them
To help Planners to not make mistakes in the maintenance work order planning and resourcing process, you do Chance of Success Mapping on their procedure. Next week’s newsletter will cover a Chance of Success analysis for maintenance planners, including how to:
Modify the process spreadsheet to gauge the chance of each process step’s success.
Find which process steps are most likely to suffer failure.
Estimate the lowest and the highest chance of success for a step.
See an example chance of success mapping for successfully doing the work order scope-out in a maintenance shutdown planning process.
There’s more information about building highly successful maintenance processes and procedures with the PWWEAM methodology, in the Industrial and Manufacturing Wellness book, from the publisher, Industrial Press. Otherwise, subscribe to this series of weekly guidance newsletters on creating a top class maintenance job planning process and resourcing procedure. When all are published, they’ll combine to help you master how to develop and write success-bringing maintenance processes and procedures with PWWEAM methodology.
Contact me if you have any questions on the above content.