


Step 5 of 7: Assess How Maintenance Planners Can Make the Most Successful Work Packs
Gauge your Maintenance Planner's Success Rate Before and After Chance of Success Analysis of the Job Planning & Resourcing Procedure to Compile Excellent Work Packs


In this post, we apply the simple Chance of Success Mapping method for safely crossing a road described in the last newsletter, to doing Chance of Success Mapping on a maintenance shutdown planning and resourcing process and procedure. The complete COS Mapping example can be downloaded using the button below.
Modify the process spreadsheet into a chance of success map to analyze each process step’s success range
Begin by replicating your current process’ steps and their procedural tasks into a new spreadsheet table to do the Chance of Success Analysis (COS Analysis).
Put each process step into its own column across the spreadsheet with each step separated by two columns. The two columns will record the worst and best chances of success.
Put each step’s procedural task descriptions in the rows under the step heading row.
Below the step tasks zone, allocate five rows for the Chance of Success calculations of the current process design.
Under the calculation rows, allocate a few rows to list the risks that will be identified in the current process steps’ tasks.
Below the current risks zone, allow for rows to list the risk mitigations to be done to eliminate or prevent each risk.
Immediately under the risk mitigation rows, provide a row for the redesigned process Chance of Success calculation.
In a column down the edge of the table, name each of the allocated zones to give context to the table.
Below is a sample COS Analysis spreadsheet layout.
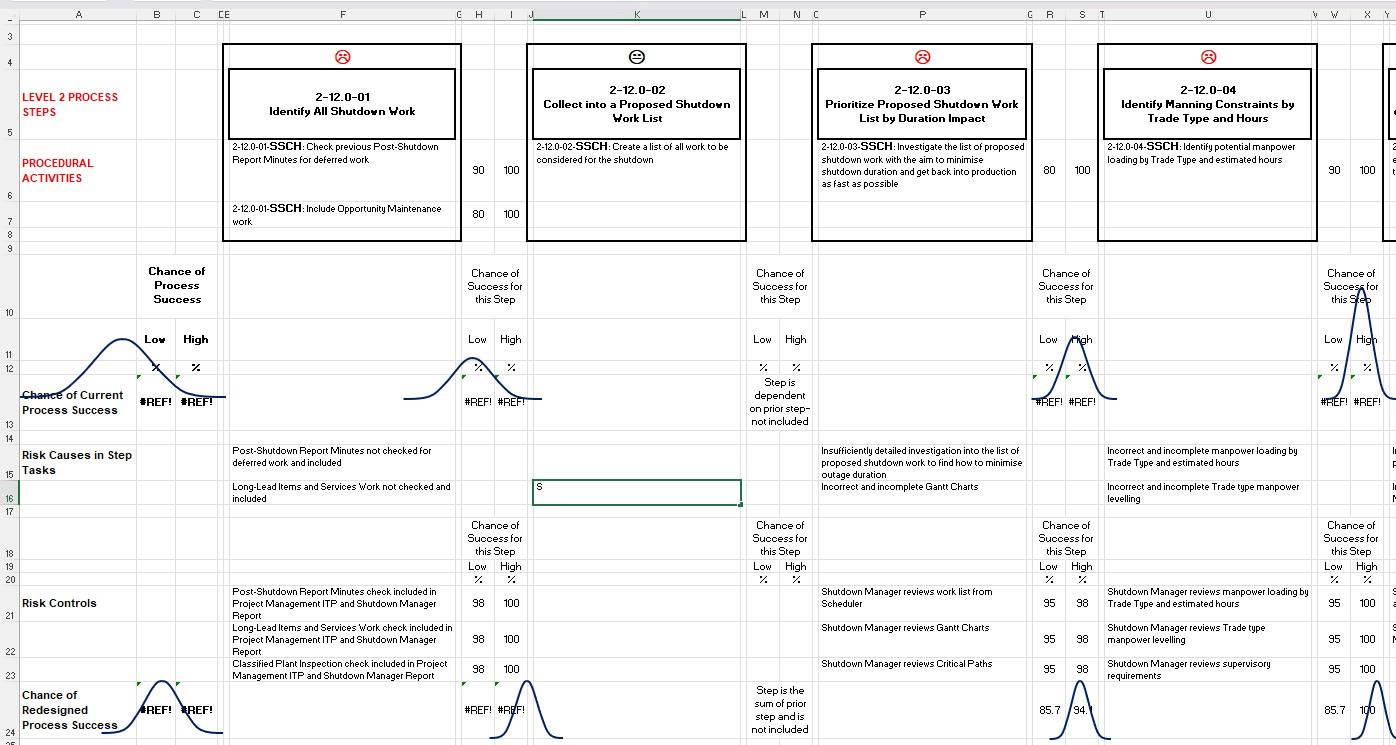
Smiley faces are used to show how vital a step is to overall process success: a sad face denotes a critical step, and a normal face is an important step. A step may be unimportant, important, or critical. It is unimportant if its failure has no adverse impact on production, personnel, or the process outcome. A step is important if, when it goes wrong, it causes a safety issue, or loss of time or money but can be corrected on-the-run to perform properly. A step is critical if, when it goes wrong, someone is harmed, production is adversely disrupted, or a step’s key outcome cannot be achieved.
List all the risks that can cause failure in each process step
The total risk to a process is the sum of the risks in all of its steps. The total risk for a step is the sum of the risks in all of its tasks. Every step has one or more function in the process, and each step must deliver all its required outcomes. When any necessary outcome is not achieved, the step has failed.
All steps need to be individually investigated to see how each task done in the step could fail. Each potential failure is a risk. When a risk of task failure is found it is noted in the spreadsheet in the allocated rows under the step heading.
Estimate the lowest and the highest current chance of success for each of the process steps
For each task risk you estimate how likely it is that no failure will happen—this is the best possible scenario. Imagine the task is done 100 times using the current procedure by persons qualified to do the work. How many times out of the 100 could the task be faultlessly done? If 90 times out of 100 the task is expected to go right, then the chance of success is 90%. That sets the upper chance of success point.
You then estimate the lowest chance of successfully doing the task. Again, imagine the task is done 100 times, but now you ask how many times out of the 100 times could the task will be wrongly done. If 40 out of 100 times it is possible the task is wrongly done, the chance of failure is 40% and chance of success is 60%.
The best (90%) and worst (60%) points establish the two ends of a frequency distribution of possible outcomes for the step. Ideally, the estimates of best and worst chances are made using historic records of the frequency of past bad outcomes and the frequency of correct results in doing each step. If that information is not available, you ask a subject matter expert to estimate the upper and lower points.
Decide how you plan to eliminate or prevent the risks and raise each task’s chance of success
When you remove a risk of task failure you automatically raise the chance of task success. For every risk, you find ways to eliminate it, or at least reduce the frequency of its occurrence. Viable risk mitigations are recorded in their portion of the table under the step heading.
Once all the risk mitigations are recorded you reassess each step’s new chance of success presuming the risk eliminations and/or risk controls are effective. Until the least chance for a step’s success increases to a high chance of success, you keep looking for better risk reductions or tighter risk controls that will surely raise a low success rate to an acceptable success rate.
An example chance of success mapping for a maintenance shutdown process and procedure
The shutdown work scope mapping example that you can download using the button at the top of this post covers the tasks that a maintenance shutdown planner needs to do to select the work orders to include in a planned maintenance shutdown. The original process and its procedure produced a massively wide range from 1% chance of success (i.e. 99% chance of process failure) to 90% chance of success (10% chance of process failure) the Planner would correctly do the shutdown work scoping.
After the PWWEAM Chance of Success Analysis was used, the likelihood of success range improved to between 40% and 92% chance of success. This range of results is much better than the original process design but there is still far to much probability of failure. The inability of this process to constantly deliver high success rates is an indicator that the process is an unsuitable design for achieving its purpose.
The next newsletter: Step 6—Making holistic changes to your maintenance job planning system and processes
Step 6 post will explain how to find great solutions to stop maintenance planning risks and embed them to build outstandingly successful planning processes. You’ll learn how to eliminate risks in the maintenance job planning process and procedure by going upstream and changing the EAM system to proactively prevent future risks and their problems from happening.
There’s more information about building highly successful maintenance processes and procedures with the PWWEAM methodology in the Industrial and Manufacturing Wellness book, from publisher, Industrial Press. You should also subscribe to this series of guidance newsletters on creating top class maintenance processes and procedures. Each post helps you master how to develop and build success-bringing processes and procedures using PWWEAM methodology.
Contact me if you have any questions on the above content.